Skip to content
Management Consulting (5)

Overview

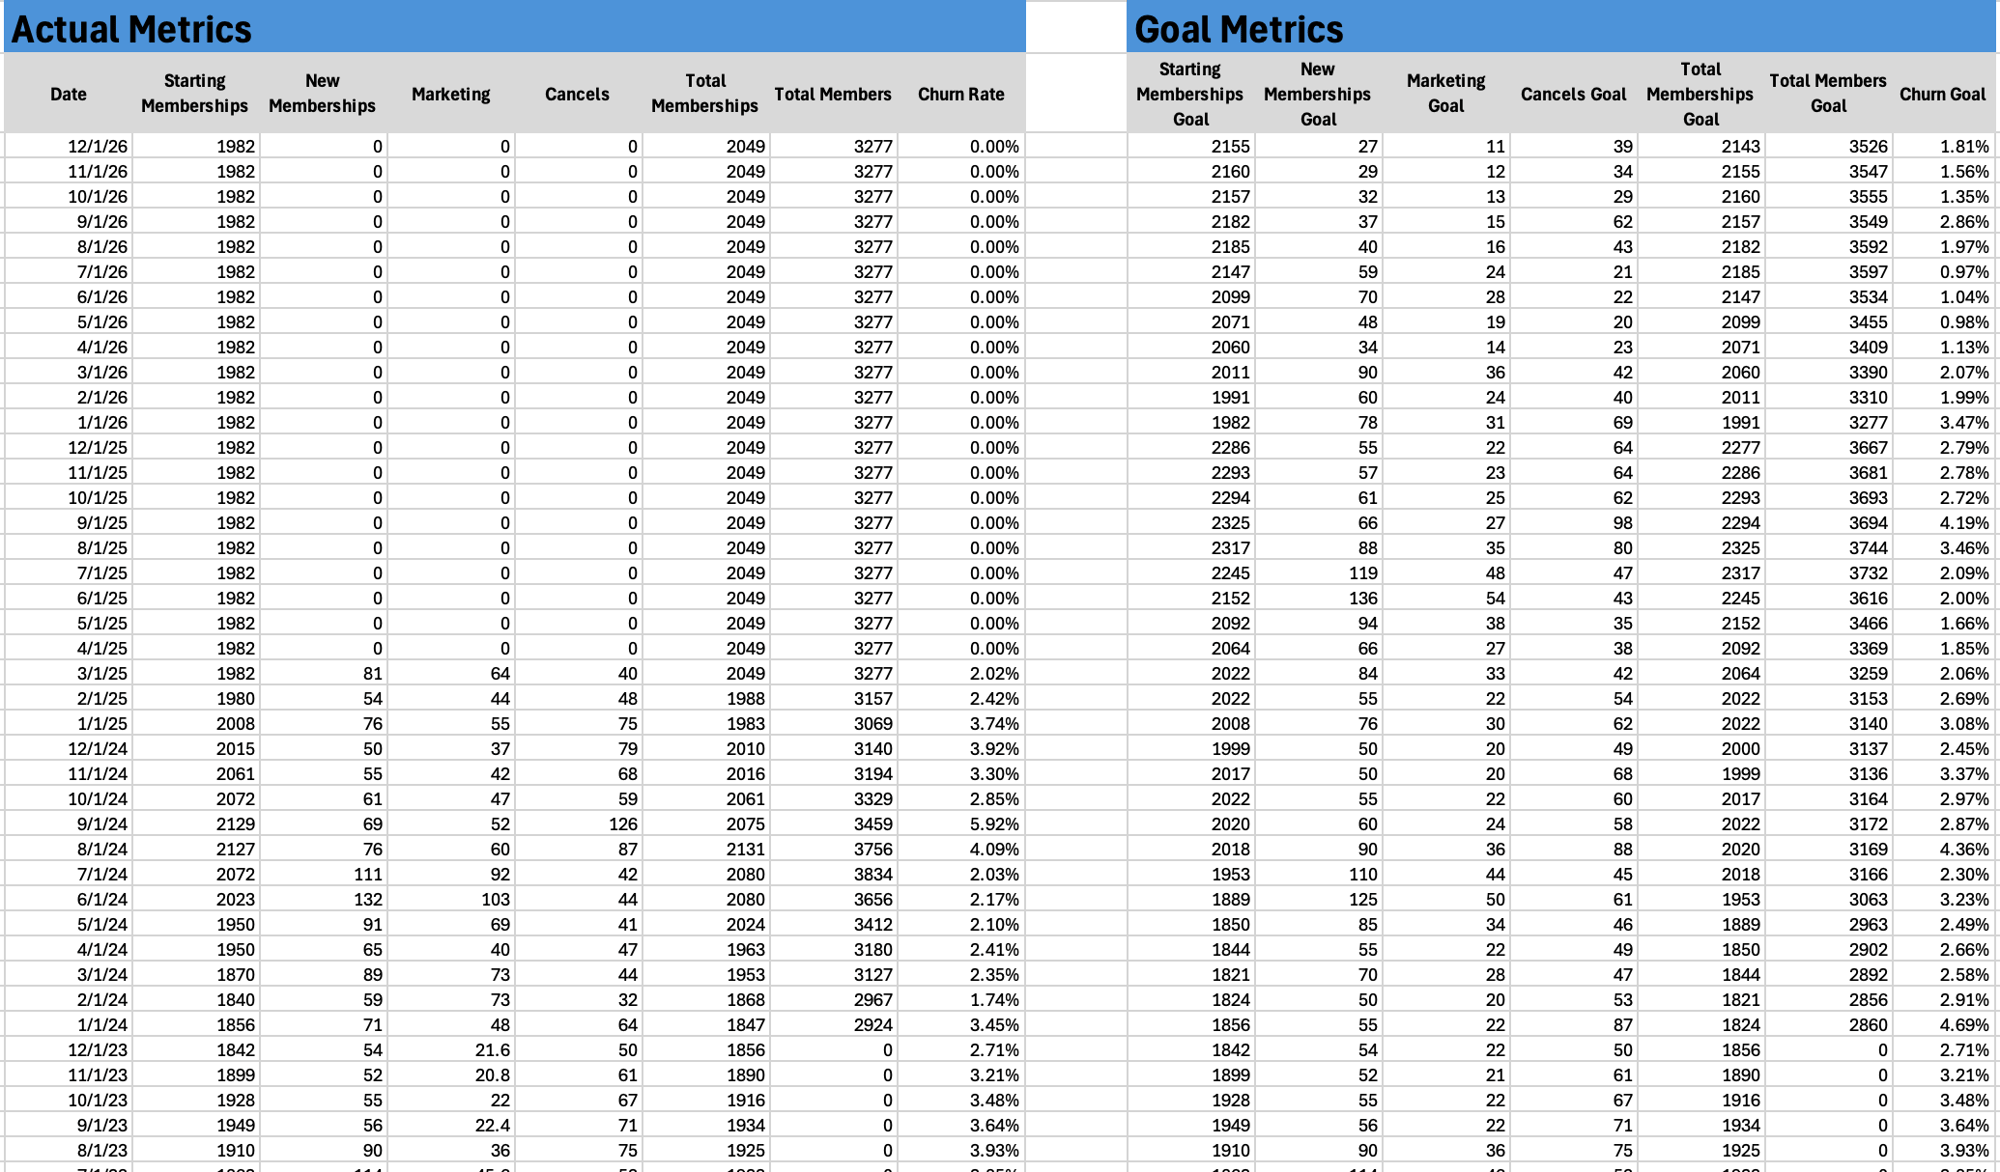
This project began with a need for accurate performance tracking and reduced administrative time from management. At the time, metrics had to be manually counted, data was siloed + inaccurate, and management was spending hours a week with administrative tasks. After consulting with department leaders about these problems, I proposed an improved system that could unify the departments data and automate critical metrics for management. 


Data and Tools

Data: Sales Traffic Books, Historical Sales Data, Cancelation Reports
Tools: Excel (Vlookup, Xlookup, Workbook Links, VBA)

Prior methods of data collected included static silos of PNM, CRM, commission tracking, sales assignments, and forecasting. I utilized Excel to create a system of tools to combine this data as well as visualize key metrics. 

Filtered Data

Challenges

Technology Limitations

As a smaller business looking for a tailored BI solution but with very limited technology, leaders requested that the entire system be built on Excel to ensure simplicity and longevity. Additionally, they needed a platform that could connect their disparate data and be interfaced easily by sales staff (data entry), management (commissions and goals, reporting, forecasting), and outside departments (customer interests, cancellation reasons) while providing critical and easily understood performance metrics.

Live System

A solution was needed quickly, and continued use of the system without shutdowns was crucial. This required the buildout to be live from its first iteration and for all subsequent additions and updates to be completed in a way that allowed continuous use of the system. 

Collaboration

In addition to working with a live system, the additions and updates proved to be a challenge all on their own. Adjusting on the fly, last-minute additions, and collaborating with multiple departments to find common solutions all called for increased flexibility and good change management. 

Walkthrough

Sales Log

Sales Logs

Need: Review of the data from current and previous sales logs showed errors and obscurity, making it unsuitable for its intended use. I presented the limitations the current system had and made recommendations to clean and visualize the data. 

Cleaning and Transformation: The data from these logs was crucial for all future implementations, so accuracy was absolutely essential. I applied various data validation and standardization techniques to ensure the data was clean and user experience was familiar to the sales team.

Visualization: I structured the traffic logs to allow for data input as well as visualizations showing daily totals, customer details, and status of sale with conditional formatting and clearly defined data fields.

Sales Dashboard

Sales Dashboard

Need: The team was previously in charge of tracking their own goal progress, meeting with the sales director to confirm numbers multiple times a month. Metrics that were relied on by multiple department were counted manually and often off the mark. I connected data from multiple sources and visualized all of the collaborating departments monthly goals. 

Data Aggregation: Combining data from daily traffic logs, cancel reports, club memberships, staff data, and commission data allows for a well rounded insight on club health.

Visualization and Insights: With the data aggregated, I created a monthly sales dashboard to unify the sales team and other collaborative departments to company-wide goals. Clear insights on marketing, cancellation reasons, and progress on individual and team goals allowed stakeholder to make quick adjustments and pivot strategy as needed. 

Commission Calculator

Commission Tool

Need: The sales manager was spending considerable time inputing and calculating commissions for the sales team, time that could be better used leading her team. I created a tool linked directly to the sales log that automated this process. 

Process Automation:  I created a tool template and linked it directly to the traffic books to give real time numbers on commissions owed to sales reps. I added flexibility by adding options to change payouts of each sale type,  NDR payout %, tier levels, audits, and split payouts. 

Goals Dashboard

Performance Dashboard

Need: Goal planning for the department was static and it was difficult for stakeholders to see where they stood compared to monthly, quarterly, and annual goals. I automated key metrics, ensuring efficiency and accuracy. 

Automation: I created a dynamic dashboard that updates in real time with connections to incoming and historic data. This allowed the sales director to confidently plan for goals a year in advance and automatically assign a fully customizable range of sales goals, view monthly/quarterly/annual overviews, and track YoY comparisons. A sales assignment sheet was also created to automatically give sales reps their goals for each month. 


Model

Connections and Scaling

Need: There was a strong need for unification across the sales reps, leadership, and other departments to realize club-wide goals. For this system to work, it required each of the individual components to be precisely linked together, allowing for real time update across multiple workbooks. 

Workbook Links: During each phase of this project, I built workbooks, dashboards, tools, and automations with connections in mind, linking each piece to a larger whole. By building this all encompassing and dynamic environment, I was able to have an impact on all vital processes and metrics that the sales team relied on. 

Scaling: I built out the entire system 6 years to allow long term usage. By consulting with leadership, I constructed solutions to a wide variety of variable changes, meeting the needs of all requests and ensuring flexibility to future changes. Additionally, I led multiple training sessions to ensure adoption and project handoff. 

Results

Eliminated 80% of Errors

By automating all essential performance tracking and administrative tasks, virtually all data entry, sales, and commission errors were eliminated. 

Reduced Administrative Tasks by 50%

Leadership previously spent hours each week tracking sales, marketing, goal planning, and commission. These tasks and more were all removed from their workload, allowing them more time to focus on executive tasks. 

8.3% Member Growth

Bridging previously siloed data across multiple teams created clarity, collaboration, and efficiency that had never been seen before, building the foundation for targets to be hit every monthly in 2024.