Skip to content
sdb

Overview

My first year as manager in 2019, I helped the cafe turn a profit for the first time in over a decade. As I ramped up in 2020 to go for a banner year... Covid. Finally becoming fully operational in 2024, I set my sights back on cafe with an objective to build a solution that would allow leaders to make key decisions based on data-driven insights. 

The cafe lacked any significant reporting, costing, or inventory tools to give a pulse on revenue or hitting targets. My goal was to deliver granular insight on item trends, price items with pinpoint accuracy, and ensure targets are hit with data backed goal setting. 

Data and Tools

Data: PoS Data, Product Data, Expense Reports, Payroll Data
Tools: Excel (Vlookup, Xlookup, Workbook Links)
Methods: 
Data Collection, Cleaning, and Transformation:
  • Extracted data from PoS software and other sources to ensure see the full picture of cafe ongoings.
  • Removed unnecessary columns, categorized products, added time series filters, and linked data, ensuring accuracy and efficiency.

Data analysis:

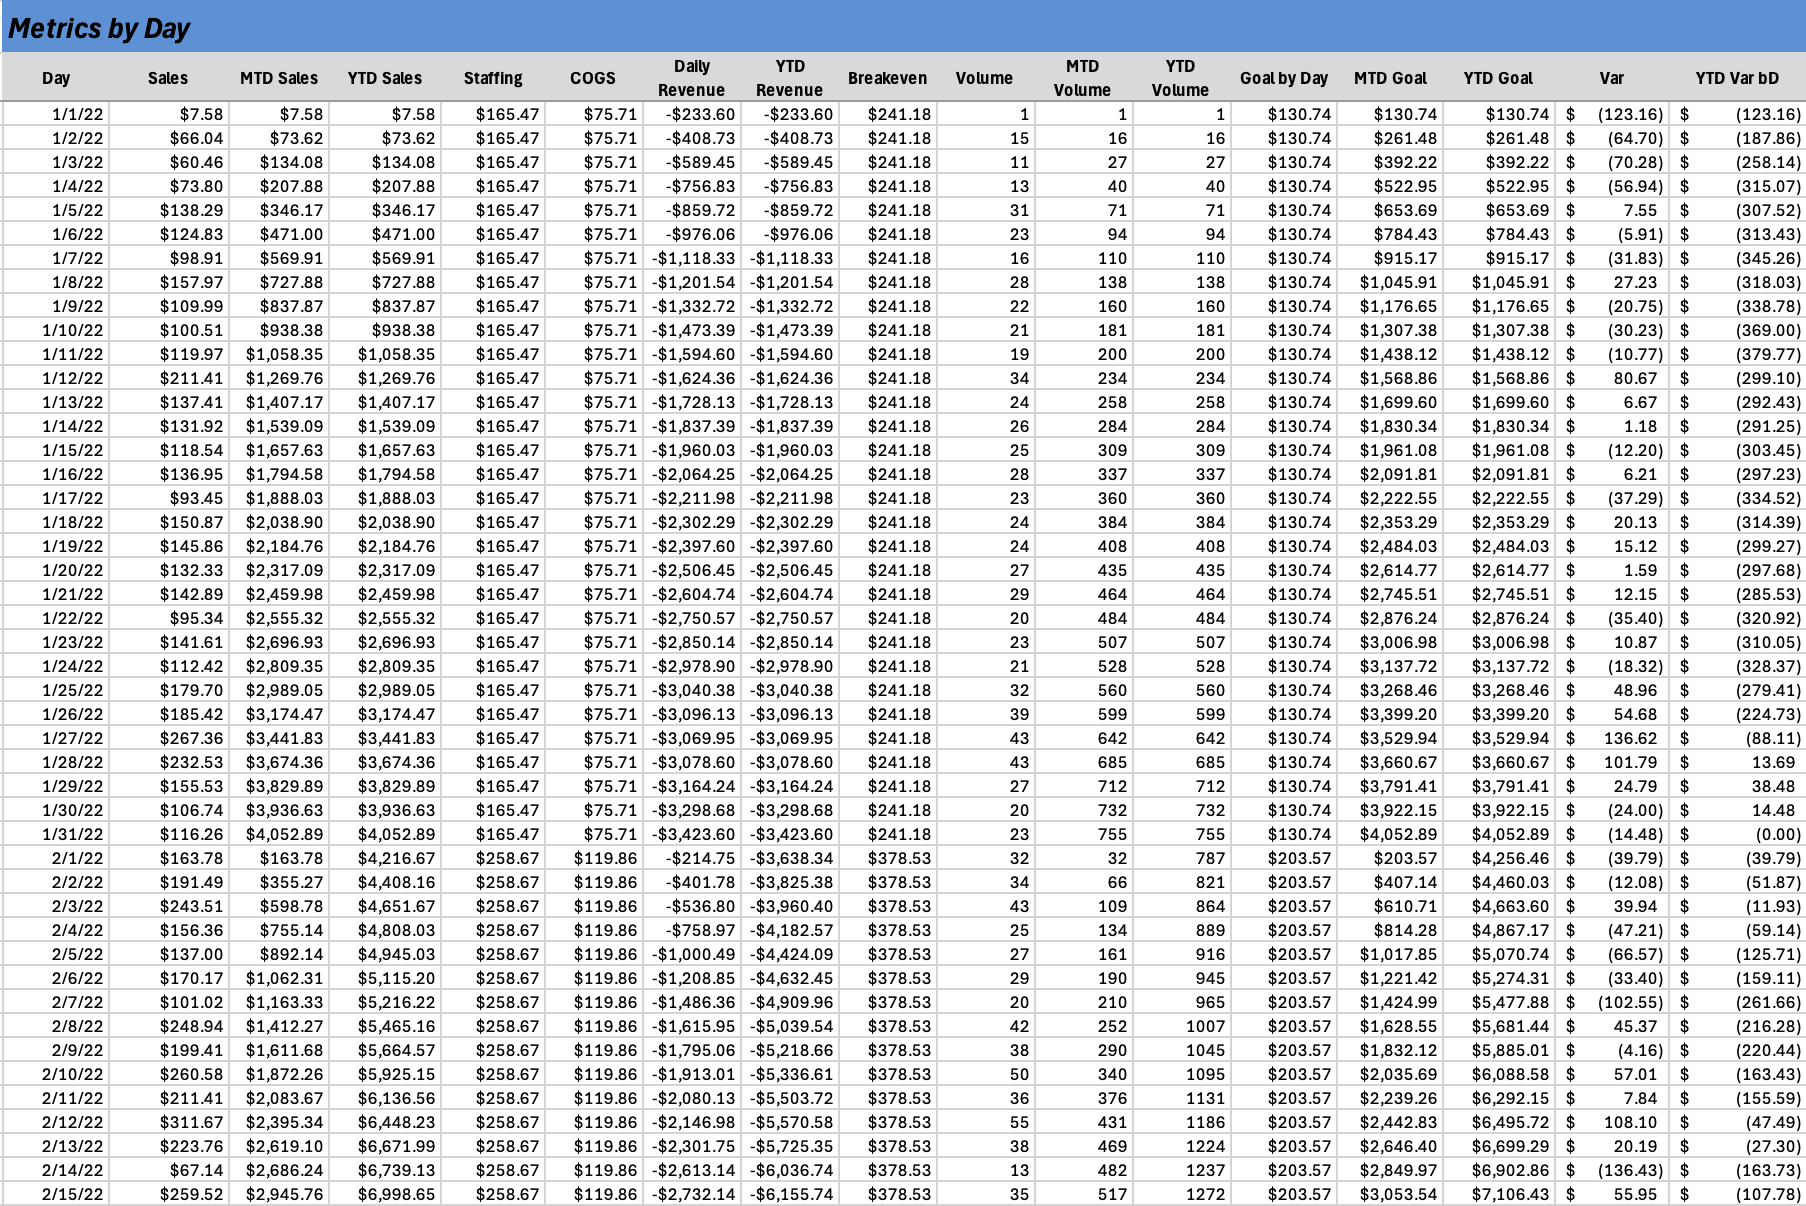
  • Summarized total revenue, averages, expenses, staffing, volume, net profit.
  • Calculated sales by hour, day, week, month, and season. 
  • Analyzed category performance by season, product trends, peak times, and item costing.

Dashboard Design and Visualization:

  • Created dashboards and visualizations to monitor key metrics including revenue, profit, top products, forecasting, 4 week averages, category overview, and target completion bars.
PoS Data

Challenges

Data Quality and Integration

This project required data to come together from multiple reports and tools, requiring cleaning, reformatting, and restructuring to ensure integration. Categories needed to be created and assigned, VBA was used to combine items that had multiple different names, and tools were specifically structured to work with interconnected reports.

Performance and Scaling

Using Excel to clean, organize, and visualize data with hundreds of thousands of cells in one workbook made it important to do so efficiently. Using faster functions like Xlookup and finding other efficient ways to update reports made a noticeable difference in load times. 

Buy-In and Adoption

Using this dashboard to make decisions was met with change resistance that needed to be addressed. Department heads needed to be shown ongoing demonstrations of dashboard capabilities and trained on understanding how it could be used to streamline decision-making. 

Walkthrough

PoS Model

Data Collection & Cleaning

Overview: To provide insights on increasing revenue, reducing costs, and adjusting quickly to meet product trends, data from a range of sources needed to be brought together.

Collection: Data was collected from PoS reports, category ADP, expense reports and more to ensure a well-rounded landscape of data.

Cleaning: I replaced outdated names, fixed inconsistent formatting, and removed irrelevant/incomplete data to give a efficient start point.  


PoS Cleaning

Transformation & Modeling

Overview: Once the data was selected, it was cleaned and organized to work with reports from the other selected sources. 

Transformation: Data was built out on many of the reports to include metrics like transaction identifiers, categories, day of week, daily/mtd/ytd totals, and more. 

Modeling: Once cleaned and transformed, relationships were established to strengthen the data and transform it even more,  was uploaded to two sources and relationships created to connections.

PoS Analysis

Aggregation & Analysis

Overview: Having our data in place, I could now start using it to paint a picture of what was happening within the department. I began by summarizing daily, monthly, and annual totals while adding calculated columns to provide an in-depth analysis. 

Aggregation: Bringing together daily, weekly, monthly, and annual totals while creating calculated columns for category totals, variance, and averages.

Analysis: I conduct and analysis to discover top-sellers, pricing optimization, seasonality, and trends. 

Dashboard-1

Dashboards and Process Automations

Overview: Once my analysis was complete, I focused on visualizing key metrics to give a granular look at cashflow. 

Dashboards: Monthly and Annual dashboards were created to understand top-sellers, 4-week trends, weekly/monthly progress toward goals, and category insights.  

Process Automations: Tools were created to calculate ingredient cost, staffing cost, item cost, and profit margin, giving stakeholders certainty and efficiency in their actions. 


Item Detail

Insights & Recommendations 

Overview: Upon review of all the all the data collected, calculated, and visualized, I shared my insights and recommendations to department leaders. 

Insights: I provided insights on an array of items, categories, trends, and targets.
Some examples:

  • 27% of the cafe's products have a below desired margin due to ingredient costs or pricing. 
  • On average, 50% of revenue comes from June, July, and August over the last 3 years.
  • Q1 '25 saw a 40% increase YoY which can be attributed in large part due to increases in smoothie, short order, and alcohol orders.

Recommendations:

  • Eliminate low performing, low margin items including Taco Plate, Chips & Salsa, as well as all of the Large size of the hot drinks. Large cup sizes are not ordered often and bring down the margin of the items considerably due to the cost.
  • Review and update pricing on the 27% of products that are below desired profit margin. Review ingredient costs and asses vendors to see if better options are available. 
  • Identify the most profitable and popular items in each category and the most popular category by month. Run a promos each month with category popularity in mind.
  • Focus on categories that are most popular and that have the most potential for growth in the summer time. Expand the Short Order and Alcohol options to capitalize on revenue.

Results

42% Revenue Growth

2025 saw an increase in revenue by 65k YoY, most of which came from increases in Smoothie, Short Order, and Alcohol sales. The majority of our price changes came from Smoothie and Short Order items, while expanding our Alcohol options greatly benefited sales. 

Out of the Red

The cafe achieved a profit margin of 7.9% in 2024, an increase over 2023's -8%. Months without a profit were reduced by 33% with the help of costs/staffing forecasts and average product margin increased by 7% with profit margin tools.  

Insights & Action

The implementation of the PoS dashboard and other tools allowed leaders to see in real time as trends changed throughout the year. This allowed for quick rotation of items if they were steadily losing popularity, breakdown of top performers, and quick visuals on desired targets.