Power BI Project

Overview
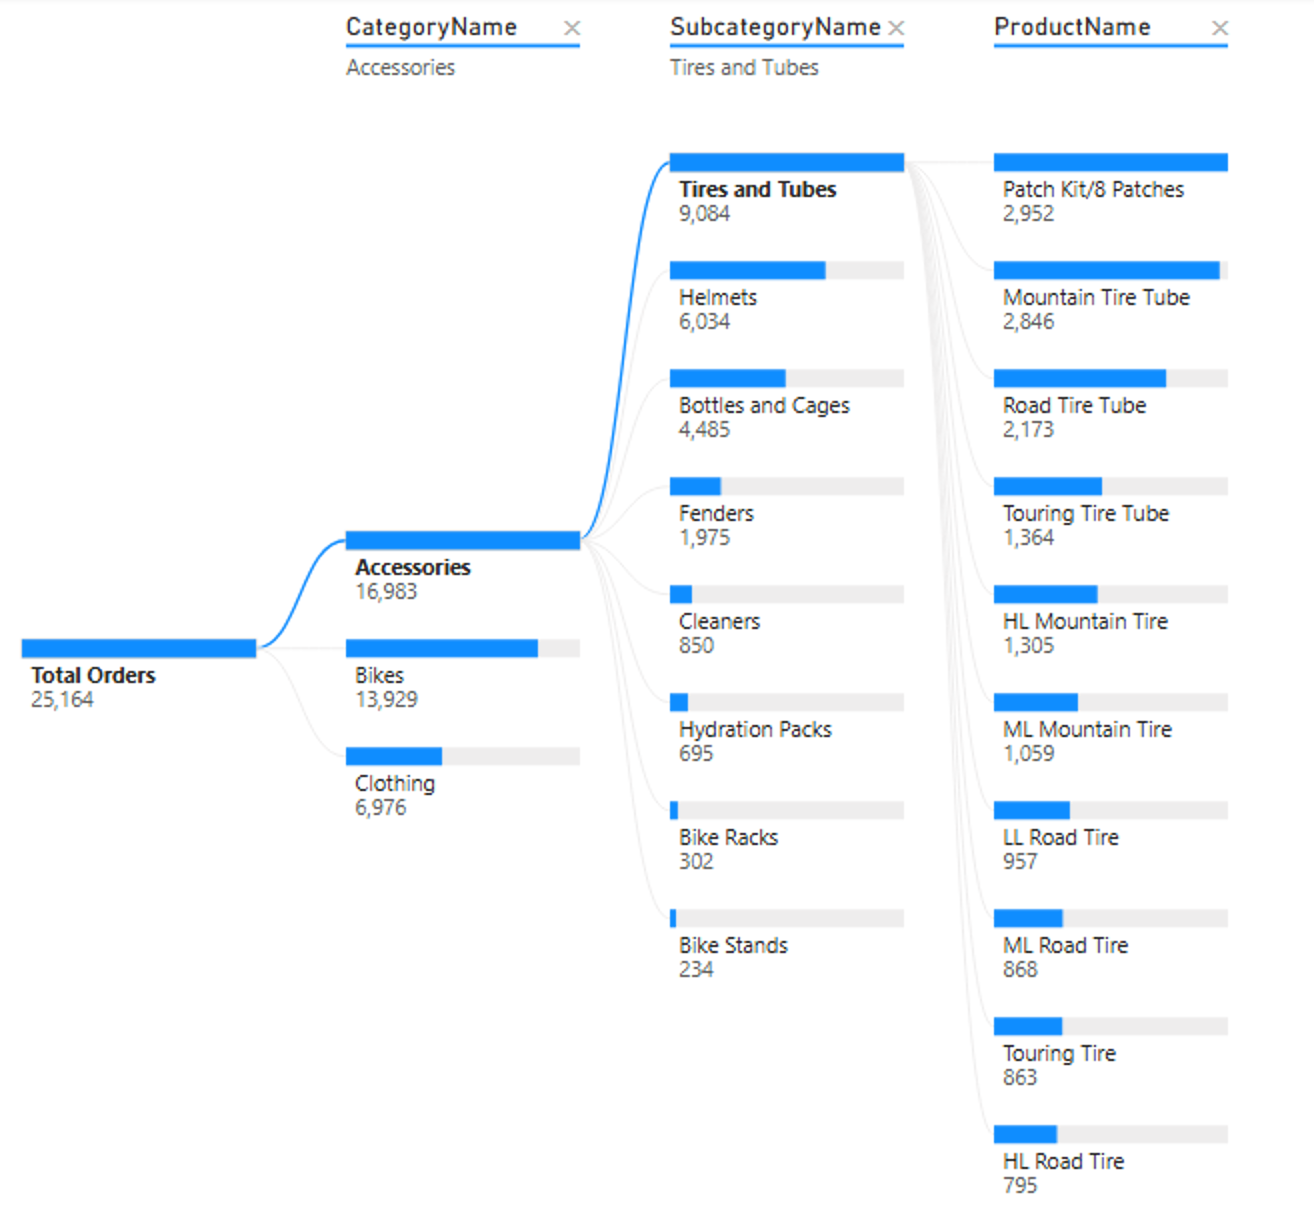
As you may have noticed, I like biking (see Turning Pedals). For this Power BI project, I was exited to use a dataset related to a company called AdventureWorks that produces bike equipment and accessories. My goal was to create engaging dashboards and visuals that gave management an efficient way to track KPIs, compare regional performance, analyze product-level trends, and identify high-value customers.
Data and Tools
Data: Customer Lookup, Product Lookup, Sales Data, Returns Data, Product Categories, Product Subcategories
Tools: Power BI
Methods:
- Connect and Transform Data
- Build a Relational Data Model
- Build Calculated Columns and Measures
- Design Interactive Dashboard and Visuals data

Challenges
Data Modeling for Insights
To achieve the desired required numerous calculated columns, measures, and custom logic to extract insights from the data. For example, product SKU category and price point were added to the Product Lookup category while over 40 measures were added to give versatility to desired metrics.
Performance
I had a strong desire to make this dashboard as efficient as possible. To do this, I had to not only ensure that table transformations and column calculations were done as far upstream as possible, but also removing unnecessary columns and using measures when necessary.
Walkthrough
Connecting & Shaping Data
Overview: The project begins with the connecting, shaping, and transformation of the multiple data sources provided by the AdventureWorks dataset.
Connecting & Shaping: Imported, explored, combined, edited data. Ensured data was in working condition with appropriately assigned data types and there were no unnecessary columns.
Transformation & Adding Columns: I added and transformed a number of columns to improve the provided data, including customer priority, education category, and quantity type.
Data Modeling
Overview: Once the data was cleaned, I began making connections to link all the data together.
Table Relationships: Primary and foreign were determined and made between customer, sales, returns, category, subcategory, territory, and calendar, setting the stage for a 360 degree view of the inner workings of the company.
Schema: A snowflake schema was used to ensure that dimension and sub-dimension tables could be included in the model.
Calculated Fields and Measures
Overview: Creating rich dashboards and visuals first required an array of calculated columns and measures. These were created using DAX to make metrics involving one or multiple tables.
Measures: Included in this project were 90-day rolling profit, profit target gap, previous month revenue, and average revenue per customer.
Dashboards and Visualizations
Overview: With everything in place, I created four dashboards to provide insights into AdventureWorks' KPIs, customer data, product details, and international trends.
Dashboards:
- An executive dashboard was created with top-preforming products as well as revenue, profit, orders, and return rates for a completely dynamic page complete with categories.
- A geospatial dashboard was created to show the number of orders received by each country.
- A product detail dashboard dives down into actual vs. target as well as a line chart with order, profit, revenue, and return metrics.
- A customer detail dashboard that provides unique customers and revenue per customer that can be drilled down on by income level and profession.
Insights & Recommendations
Insights:
- $23.6 of AdventureWorks $24.9 million dollars in revenue between 2020 and 2022 came from its bike category, about 95%. This category has shown a significant increase in orders since 2020, unlike accessories and apparel.
- The AWC Logo Cap has about 35K or revenue over two years, or about 10% of its total apparel category.
- The largest amount of orders by occupation came from professionals (7925) with 5999 of those orders coming from those with average income levels.
Recommendations:
- Assess top returned items with provided product dashboard and determined whether to make updates or remove it.
- The clothing category has the most opportunity for growth due to its low overall revenue and relatively even order history. A boost in promotions and refreshing options to could lead to more ordering.
Results
42% Revenue Growth
2025 saw an increase in revenue by 65k YoY, most of which came from increases in Smoothie, Short Order, and Alcohol sales. The majority of our price changes came from Smoothie and Short Order items, while expanding our Alcohol options greatly benefited sales.